See below for our full report for June 2019 and please let us know if you have any questions. We email this market infographic report on the Denver Real Estate Market each month. To get on the email list, please reach out to marketing@usajrealty.com and request to be added.
Update on the Denver Housing Market
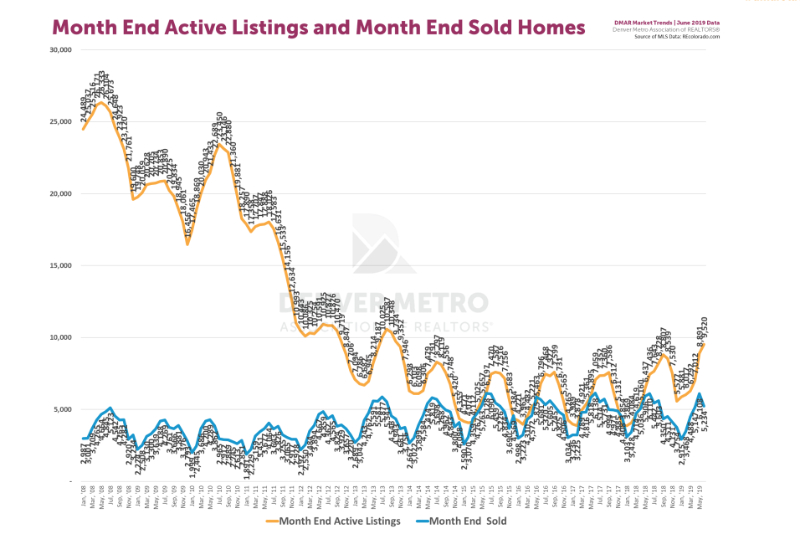
The Denver housing market is looking different today than it has over the last few years. Interest rates are very low, but inventory has been on a steady rise for the last 6 months: it rose to 9,520 active listings in June. Year-over-year, the average sales prices were up slightly, but down modestly month-over-month. With inventory up and interest rates low, it may be the perfect time to buy a home. People looking to purchase a home will have more options and will also be able to lock down a great rate for the next 15 or 30 years. However, buyer confidence is not only affected by interest rates and amount of inventory. Readily available down payments, economic outlook, and consumer confidence also come into play. If you are thinking it’s the right time for you, Usaj Realty can assist you from start to finish.
A telling sign that sellers should be aware of is the “Days on Market” and how that affects your home selling strategy. According to DMAR, “The median days on market was up 66.67 percent from six days at this point last year, to 10 so far in 2019.” The number of homes that sold was also down month-over-month, which tells us buyers are not quickly snapping up homes the moment they come available, but may have a little more time to consider their decisions and negotiate terms. Sellers need to be aware of the competitiveness, and price their homes and set their expectations, accordingly. It is still a sellers’ market (for most price points), but one that is shifting as inventory grows and buyers gain more wiggle room to negotiate.
The number of active homes compared to the number of homes sold dictate how the market is doing. It is supply vs. demand in its most basic form. This DMAR chart displays perfectly where we’ve been and where we are currently at:
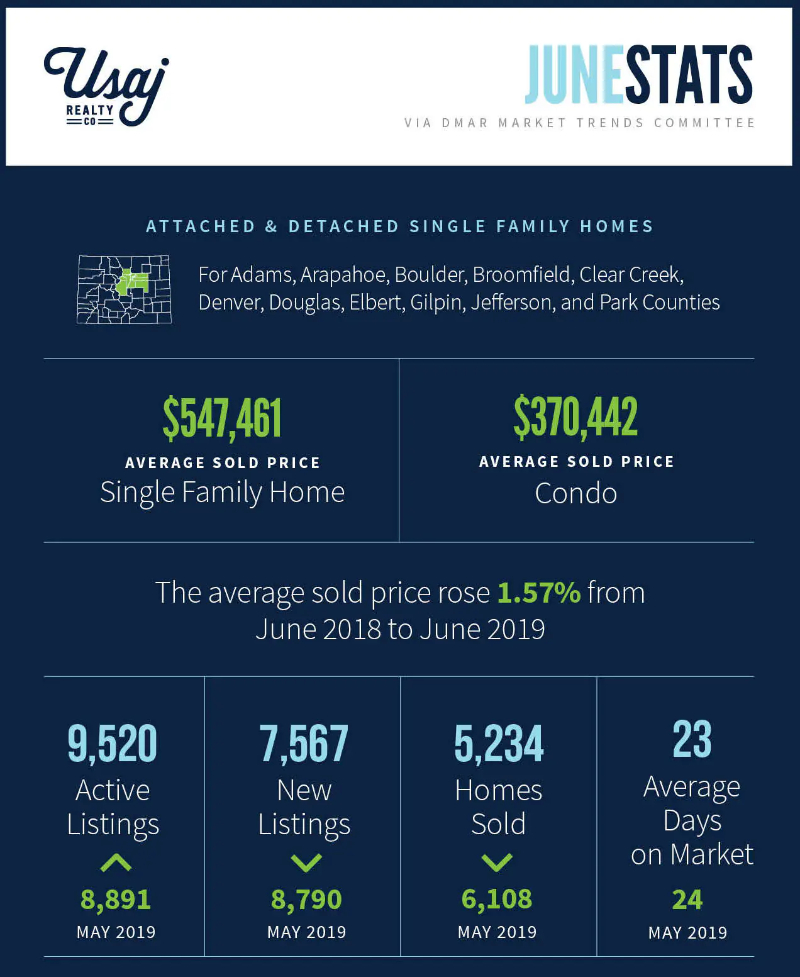
Key Takeaways for June 2019 via DMAR
Stats below include data for Adams, Arapahoe, Boulder, Broomfield, Clear Creek, Denver, Douglas, Elbert, Gilpin, Jefferson, and Park Counties
- Active Inventory in June 2019: 9,520
- May 2019: 8,891
- April 2019: 7,012
- March 2019: 6,292
- February 2019: 6,017
- January 2019: 5,881
- December 2018: 5,577
- November 2018: 7,530
- October 2018: 8,539
- September 2018: 8,807
- August 2018: 8,228
- July 2018: 7,643
- June 2018: 7,436
- May 2018: 6,437
- April 2018: 5,160
- March 2018: 4,619
- February 2018: 4,084
- January 2018: 3,869
- December 2017: 3,854
- November 2017: 5,131
- October 2017: 6,312
- September 2017: 7,586
- August 2017: 7,360
- Median Sold Price for a condo in Denver metro in June 2019 was: $310,000
- May 2019: $315,000
- April 2019: $305,000
- March 2019: $300,000
- February 2019: $297,500
- January 2019: $290,000
- December 2018: $298,225
- November 2018: $299,450
- October 2018: $299,250
- September 2018: $301,625
- August 2018: $299,000
- July 2018: $300,000
- June 2018: $305,000
- May 2018: $306,331
- April 2018: $297,000
- March 2018: $295,000
- February 2018: $296,000
- January 2018: $285,000
- December 2017: $285,000
- November 2017: $272,000
- October 2017: $275,000
- September 2017: $268,000
- August 2017 $275,000
- July 2017: $270,100
- Median Sold Price for a single-family residence in Denver metro in June 2019 was: $465,000
- May 2019: $470,000
- April 2019: $460,000
- March 2019: $450,000
- February 2019: $430,100
- January 2019: $425,000
- December 2018: $430,000
- November 2018: $427,000
- October 2018: $435,000
- September 2018: $428,000
- August 2018: $445,000
- July 2018: $450,000
- June 2018: $452,500
- May 2018: $450,000
- April 2018: $455,000
- March 2018: $440,875
- February 2018: $435,000
- January 2018: $416,000
- December 2017: $415,000
- November 2017: $405,000
- October 2017: $415,000
- September 2017: $409,000
- August 2017: $410,000
- July 2017: $420,000
What’s Happening in Denver:
Denver is second in U.S. in attracting renters from other big cities like New York City, Chicago and D.C.
Why building walkable cities is the key to economic success
“On nearly every metric, walkable developments perform better for their citizens, especially economically, which makes it that much more disappointing that so many established policy decisions fly in the face of this data…The 2019 report found the top six cities for walkable urbanism, in descending order, include New York, Denver, Boston, Washington D.C., San Francisco, and Chicago. Denver may seem out of place for those not familiar with recent developments, but, since 2003, it has been “on a walkable urban infrastructure investment boom” due to the expansion of and investment in rail transit, which has sparked a “renaissance of walkable urbanism.” – Curbed
Denver’s finance brain trust is monitoring slower growth
“There’s no need to bury cash in the backyard, but Denver is raking in less money from sales taxes than expected and the city’s finance officials are closely monitoring the situation.
Its coffers are still growing, but at a slower rate. Sales and use taxes have dropped compared to last year. That revenue funds about half of Denver’s general budget.
People are still buying stuff, just not at the same clip. In the first quarter of 2019, sales tax income grew at a rate of 2.6 percent, compared to more than 8 percent over the same period last year, according to the city’s budget office. Officials had forecasted 5.5 percent growth.” – Denverite
Not just San Francisco: City housing markets all over the world are far too expensive
“Consider a trendy city, beloved by tourists and also home to a thriving economy and plenty of industry. Now its housing market is starting to feel a bit strained. As an academic who grew up there put it, “Prices here began to take off and within a few years were growing at annual rates of over 15%,” after the housing crisis bottomed out.” – Market Watch
Halfway Into 2019, How Is The Housing Market Holding Up?
“Ultimately after a long post-recession hot streak, housing was due to break fever. The hope is that the market will heat up a little slower next time and create some normalcy. For now, consider it a short-term correction, and hope that more homes will come on the market that people can actually afford.” – Forbes
Report for Metro Denver:
Read Denver Metro Association of Realtor’s full report on last month’s Real Estate trends and statistics in Denver here.