See below for our full report for September 2018 and please let us know if you have any questions. We email this market infographic report on the Denver Real Estate Market each month. To get on the email list, please reach out to marketing@usajrealty.com and request to be added!
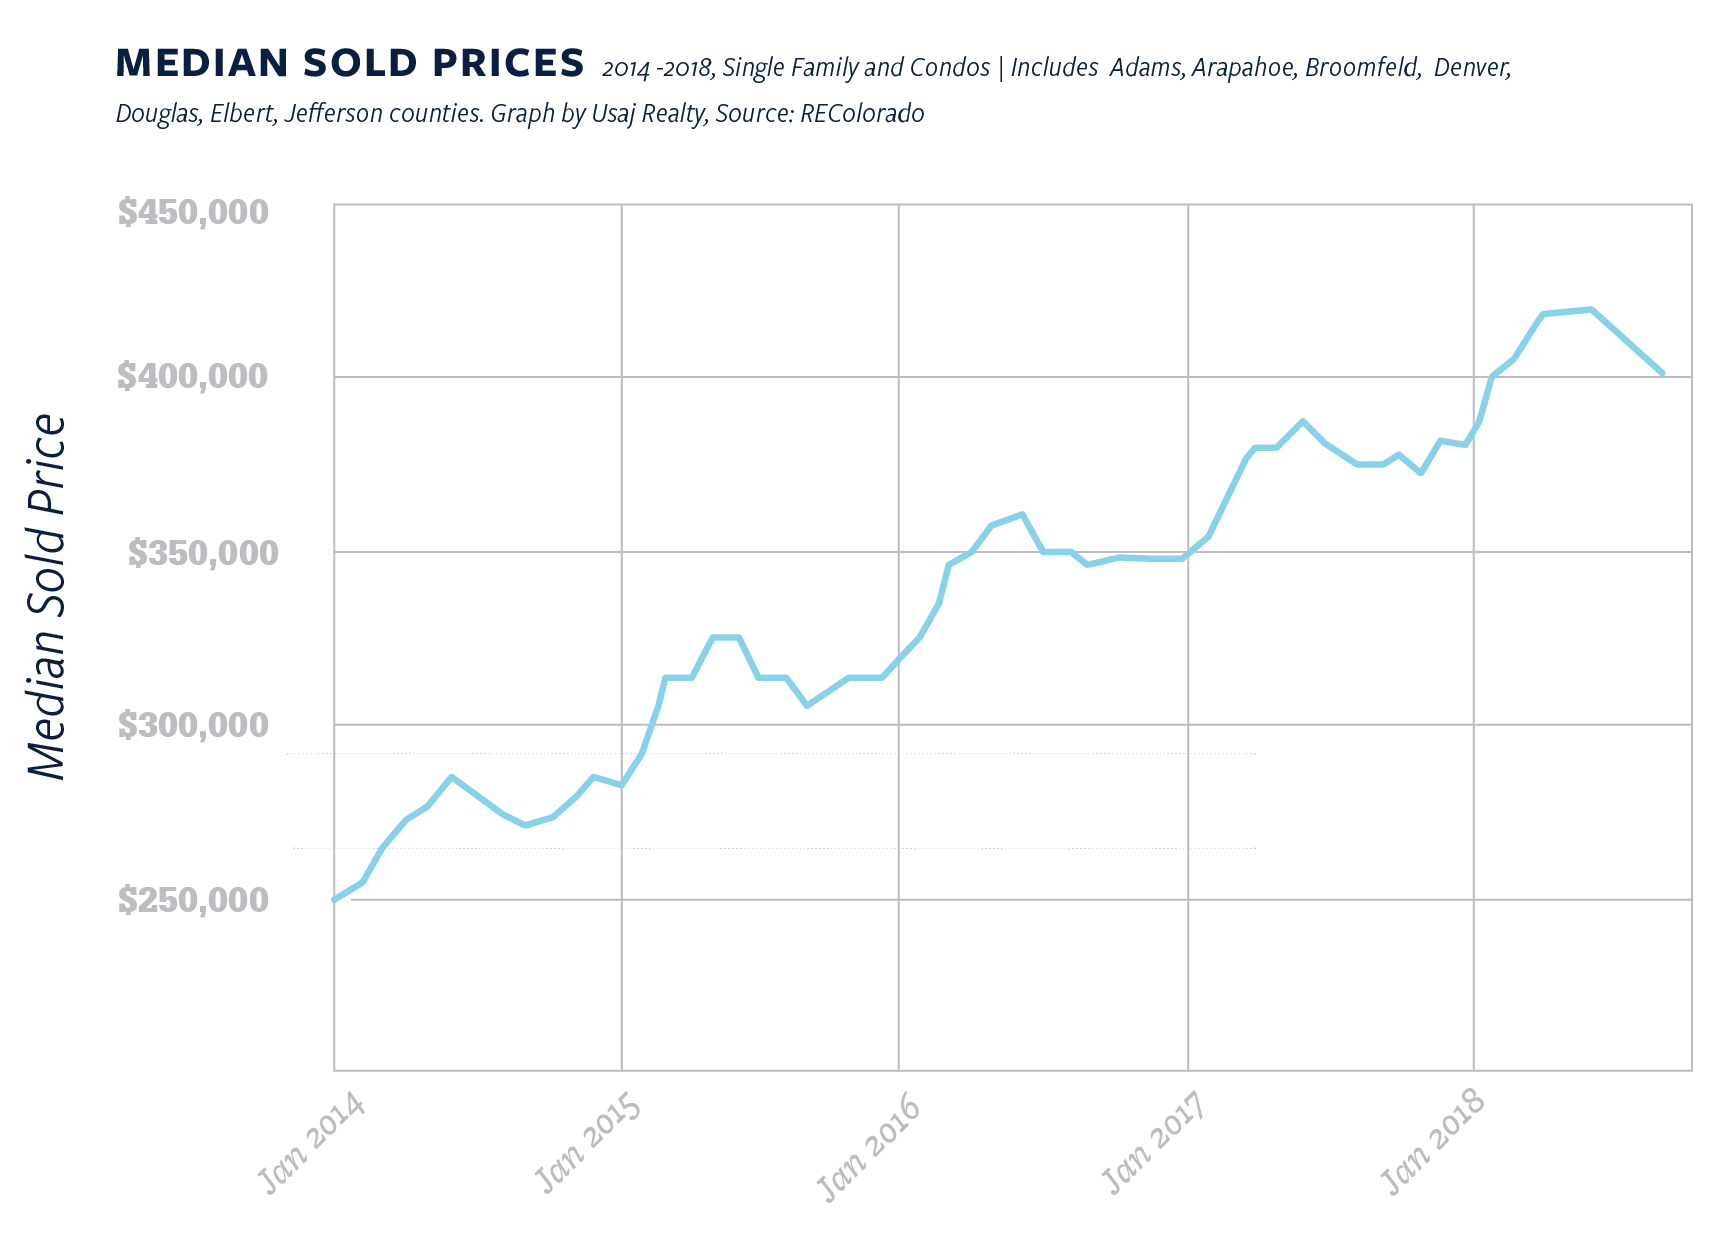
2018 prices have so far hit their peak in May and June at $416,000 for median sale price for attached and detached homes (Source: REcolorado, only including Adams, Arapahoe, Broomfield, Denver, Douglas, Elbert and Jefferson counties. DMAR’s report also includes Boulder, Clear Creek, Glipin, and Park counties which we did not include in the 2 charts below). Q4 will tell us if those prices will remain the high-point for the rest of the year, but it’s likely we will see a dip again before the year is out.
While sold prices have consistently gone down month-over-month since June, year-over-year they are higher each month. For example, September’s median sold price was $398,950 and last year it was $374,000. Seasonally, it is typical to see this dip during the cooler months of the year. See chart below:
Inventory was up in Adams, Arapahoe, Broomfield, Denver, Douglas, Elbert and Jefferson counties. There were 8,261 active listings in September 2018, the highest number in four years. The last time inventory was so high, it was August 2014 with 8,452! However, a balanced market would have about 32,000 active listings, so we are not close to a balanced buyer and seller market.
Number of homes sold was down considerably, at 3,889 this month, a drop from 5,165 in August. A drop this time of year is typical, as shown by the chart below: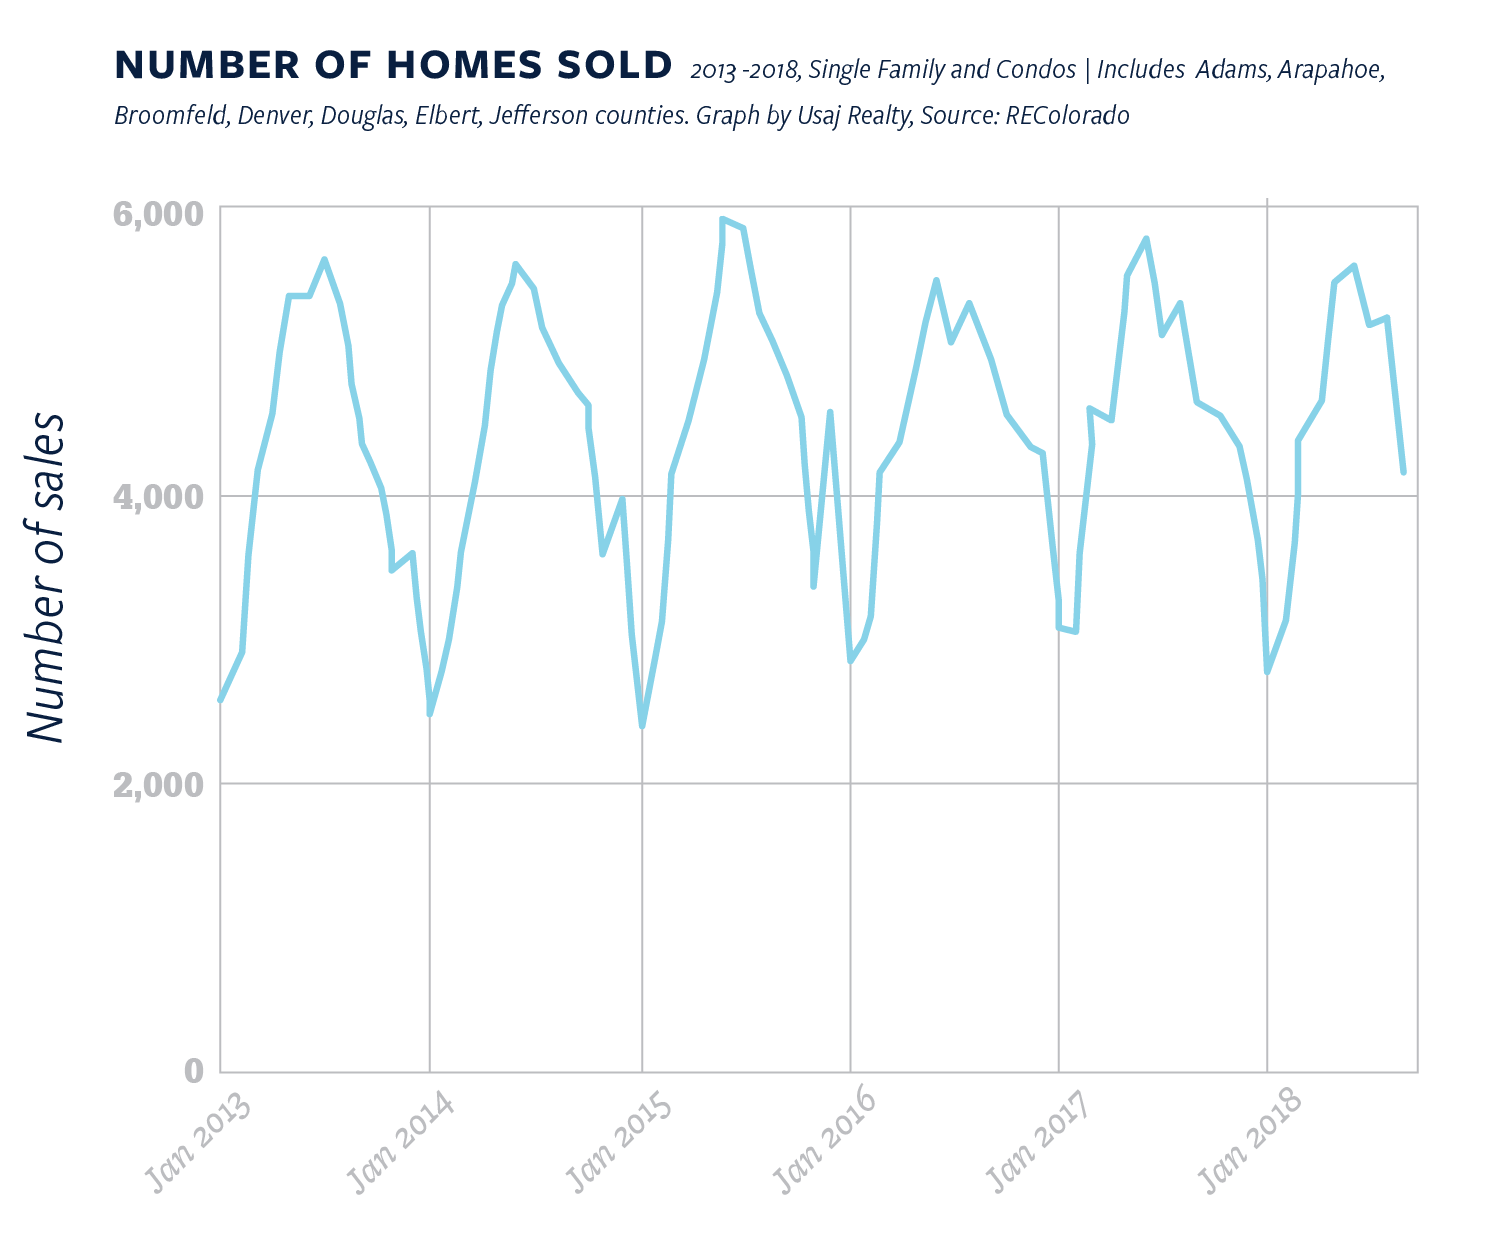
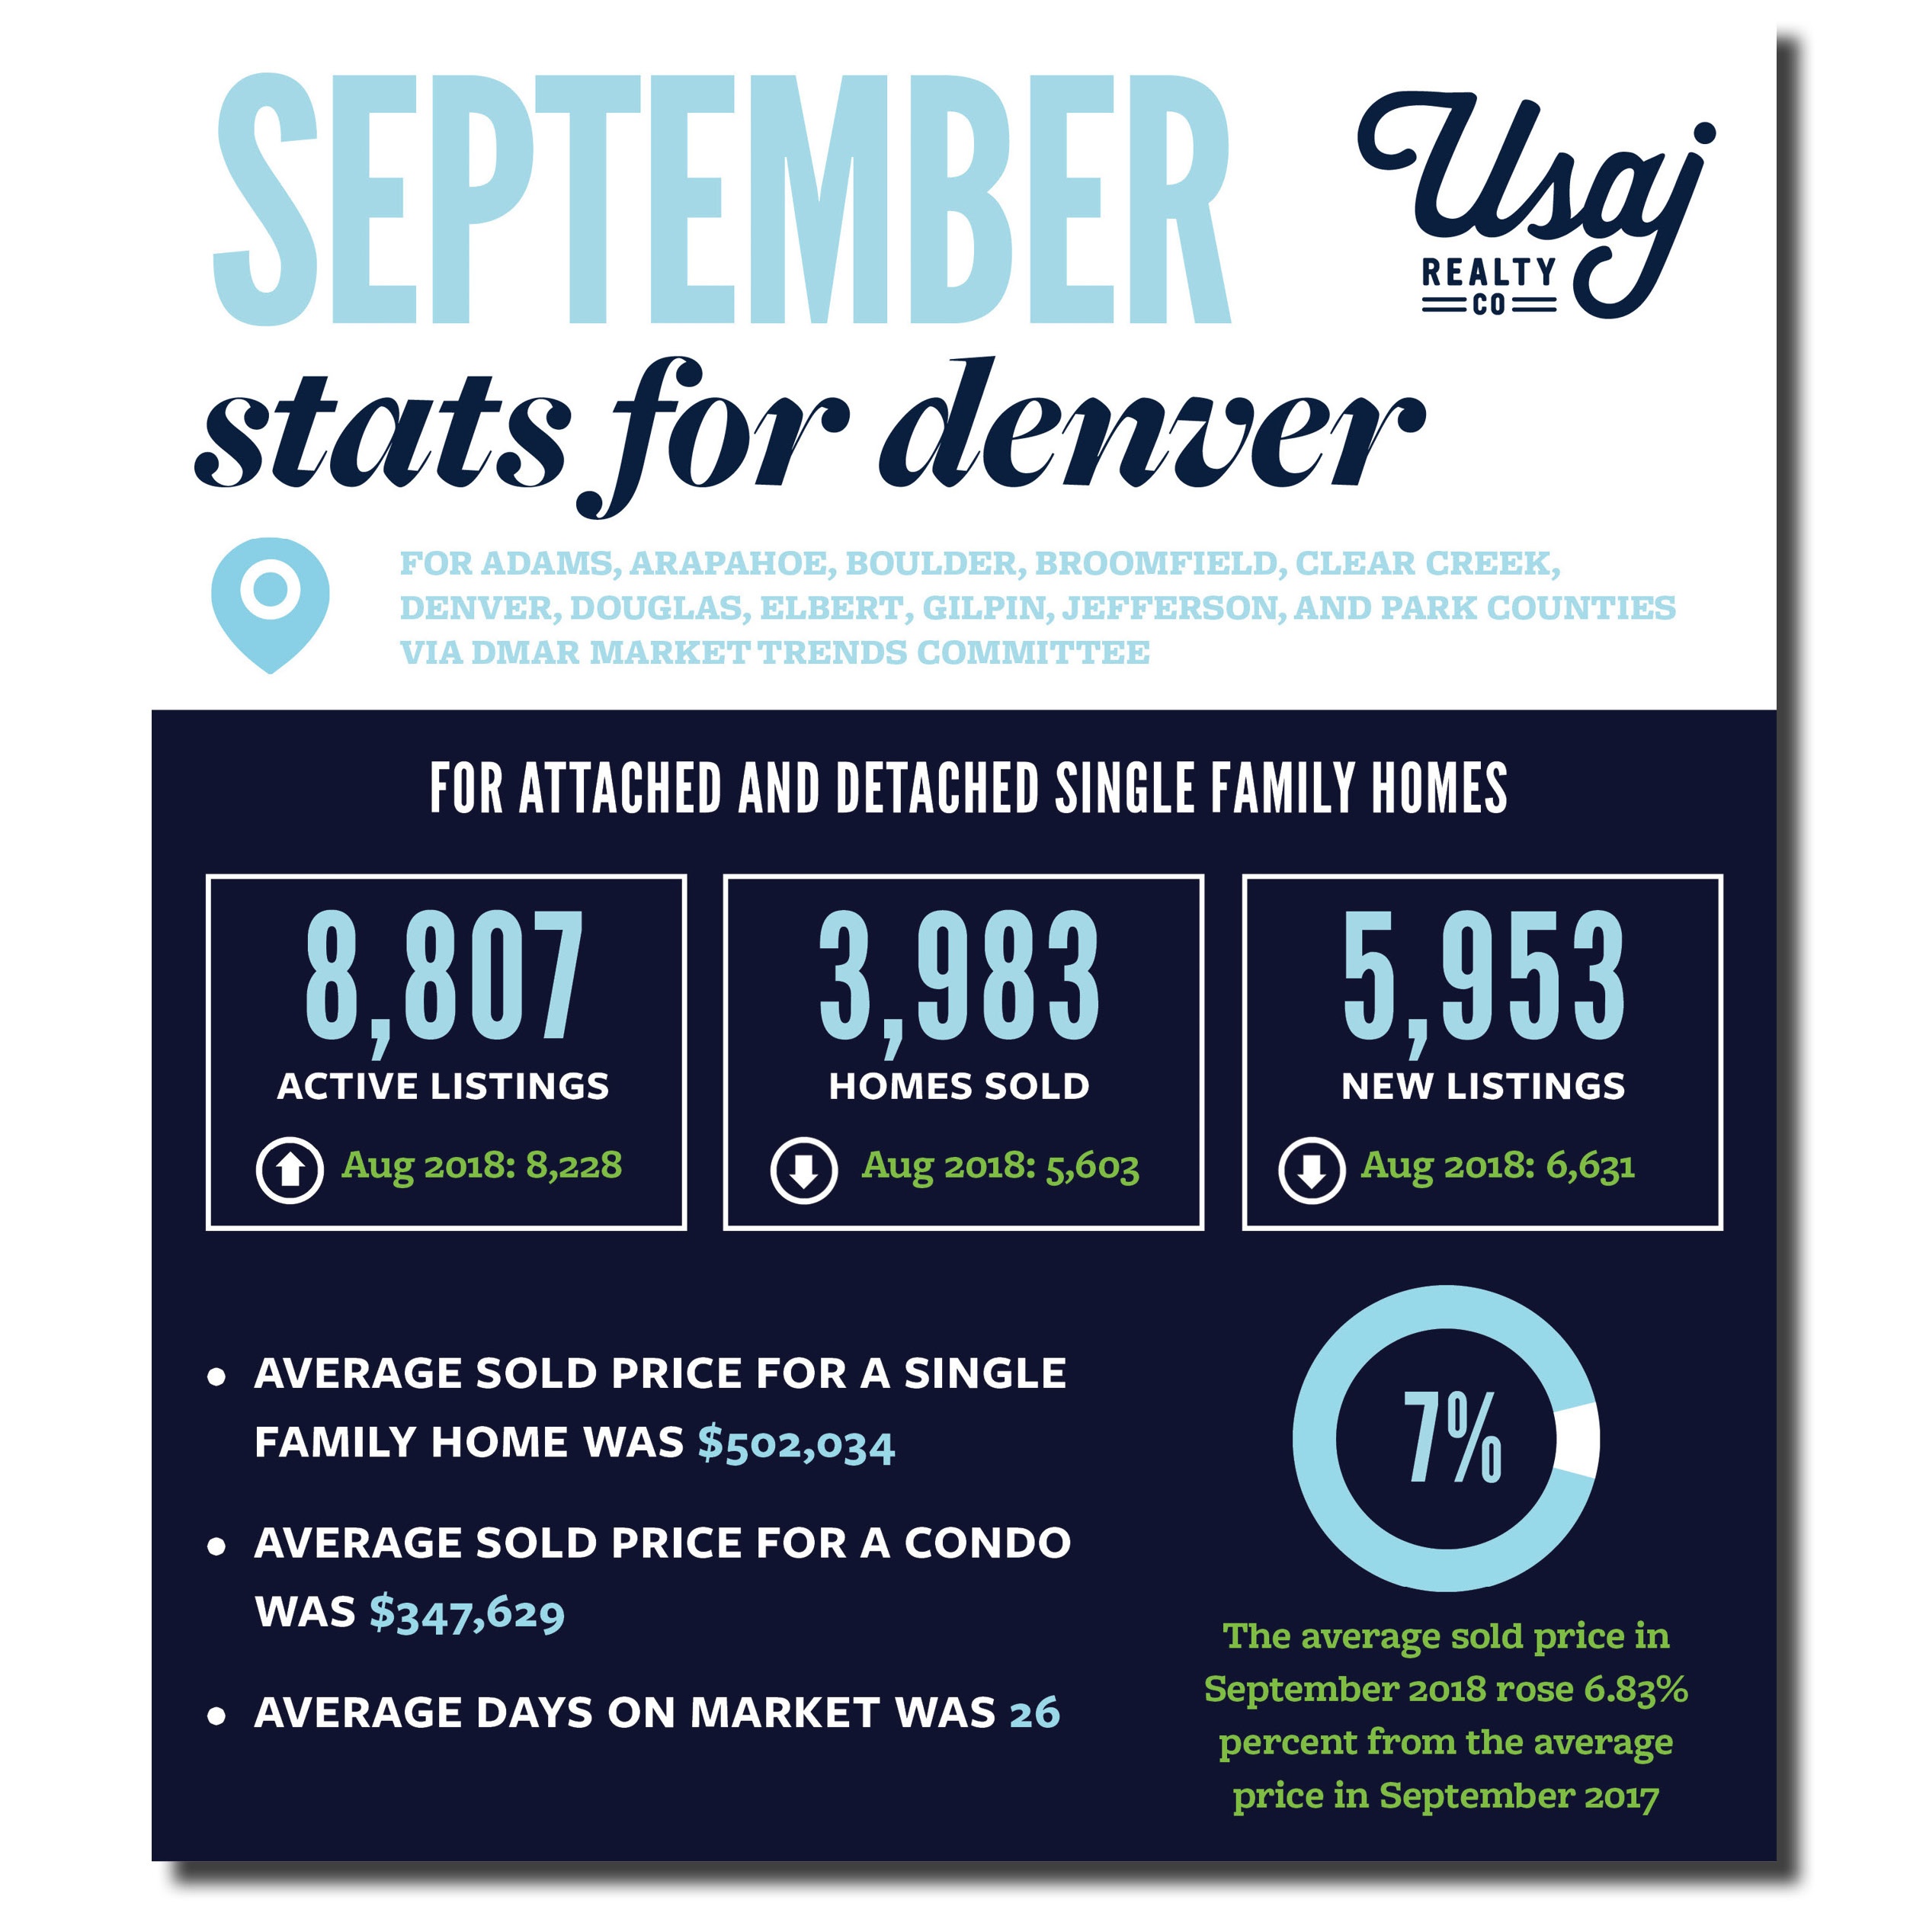
Key Takeaways for September 2018 via DMAR for Metro Denver
Stats below include data for Adams, Arapahoe, Boulder, Broomfield, Clear Creek, Denver, Douglas, Elbert, Gilpin, Jefferson, and Park Counties
- Active Inventory in September 2018: 8,807
- August 2018 Active Listings: 8,228
- July 2018 Active Listings: 7,643
- June 2018 Active Listings: 7,436
- May 2018 Active Listings: 6,437
- April 2018 Active Listings: 5,160
- March 2018 Active Listings: 4,619
- February 2018 Active Listings: 4,084
- January 2018 Active Listings: 3,869
- December 2017 Active Listings: 3,854
- November 2017 Active Listing: 5,131
- October 2017 Active Listing: 6,312
- September 2017 Active Listings: 7,586
- August 2017 Active Listings: 7,360
- Median Sales Price for a condo in Metro Denver in September 2018: $301,625
- August 2018: $299,000
- July 2018: $300,000
- June 2018: $305,000
- May 2018: $306,331
- April 2018: $297,000
- March 2018: $295,000
- February 2018: $296,000
- January 2018: $285,000
- December 2017: $285,000
- November 2017: $272,000
- October 2017: $275,000
- September 2017: $268,000
- August 2017 $275,000
- July 2017: $270,100
- Median Sales Price a single-family residence in Metro Denver in September 2018 was: $428,000
- August 2018: $445,000
- July 2018: $450,000
- June 2018: $452,500
- May 2018: $450,000
- April 2018: $455,000
- March 2018: $440,875
- February 2018: $435,000
- January 2018 was $416,000
- December 2017: $415,000
- November 2017: $405,000
- October 2017: $415,000
- September 2017: $409,000
- August 2017: $410,000
- July 2017: $420,000
An Overview of the National Market:
MBA: Weekly mortgage applications remain steady
15-year fixed-rate mortgages increase to highest level since April 2010.Mortgage applications didn’t budge for the week ending on September 28, 2018, according to data from the Mortgage Bankers Association’s Weekly Mortgage Applications Survey. – Housing Wire
Freddie Mac: September forecast indicates affordability continues to weaken growth
“Homebuilder constraints predicted to move home sales below 2018’s level. A robust economy has not been able to ignite an underwhelming housing market, according to Freddie Mac’s September Forecast. According to the U.S. Bureau of Economic Analysis, real gross domestic product increased at an annual rate of 4.2% in the second quarter of 2018. This is the fastest pace of growth in nearly four years.” – Housing Wire
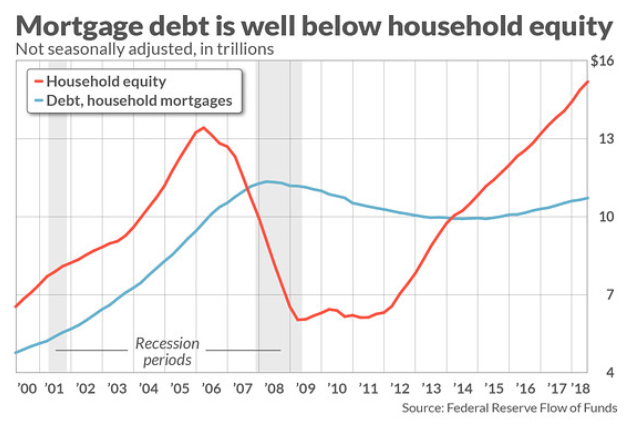
This chart shows the haves and have-nots of the housing market, and it’s getting worse
“More than a decade after the housing crisis, homeowners have been made whole — and then some. But the amount of mortgage debt that Americans owe still hasn’t returned to its previous, pre-crisis high. Those two numbers together say a lot — not all of it happy — about the state of our national housing market.” – Market Watch, see chart below:
Apartment List: nearly 50% of renters are cost burdened
“Nearly 50% of U.S. renters are cost burdened and spend 30% or more of their income on housing.” – Housing Wire
What’s Happening in Denver:
September update from Denver Metro Association of Realtors
“Housing inventory continues increasing despite typical seasonal decrease, home prices fall and sales of single-family homes priced over $500,000 drop in September.” – DMAR
Colorado executives losing confidence in economy, survey says
“Business optimism for the next two quarters in Colorado took a dive, likely because of rising economic and political uncertainty, according to the latest Leeds Business Confidence Index (LBCI) from the University of Colorado Boulder.” – Denver Post
Denver ranked as a top-10 rising city for startups
“Here’s some good news following Denver Startup Week 2018: Denver is a top 10 rising city for startups, according to the latest rankings from Forbes magazine…Denver came in at No. 4, behind Columbus, St. Louis and Atlanta. Baltimore, Cincinnati, Portland, Philadelphia, Minneapolis-St. Paul and Charlotte rounded out the top 10.” – Denver Business Journal
Swanky, high-end apartments make up a third of all units in Denver
“In 2012, high-end apartment buildings represented about half of the total built in the country. Last year, that share had risen to 79 percent, or 1,270 out of 1,600 buildings. In the first half of this year, 87 percent of new apartment projects with 50 or more units were high-end. In the city of Denver, the share of new construction devoted to luxury apartment buildings is actually moving lower, from 96 percent in 2015 to 88 percent of the total last year to 83 percent in the first half of this year. Faced with high construction costs, a limited supply of urban lots, and continued demand for rentals, developers have focused their efforts on apartments with nicer amenities that can command higher rents and a higher return.” – Denver Post
Colorado personal income gains remain strong
“Colorado personal incomes rose at an annual pace of 5.3 percent in the second quarter, down from 5.4 percent in the first. Nationally, the rate of personal income growth downshifted from 5 percent to 4.2 percent over the same period. Personal income consists of what people earn from work; what they make from owning property, a business or financial assets; as well as government transfers, like Social Security.” – Denver Post
Report for Metro Denver:
Read Denver Metro Association of Realtor’s full report on last month’s Real Estate trends and statistics in Denver here.
And as always, please let us know if you have any questions!